Personal Perspectives
Article Summary
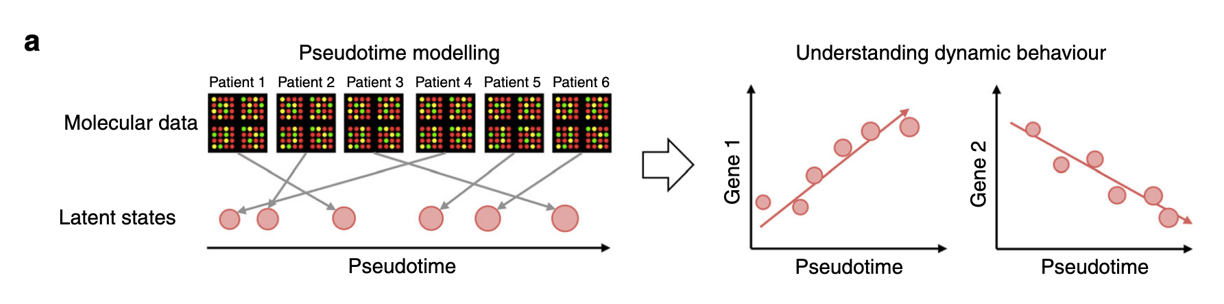
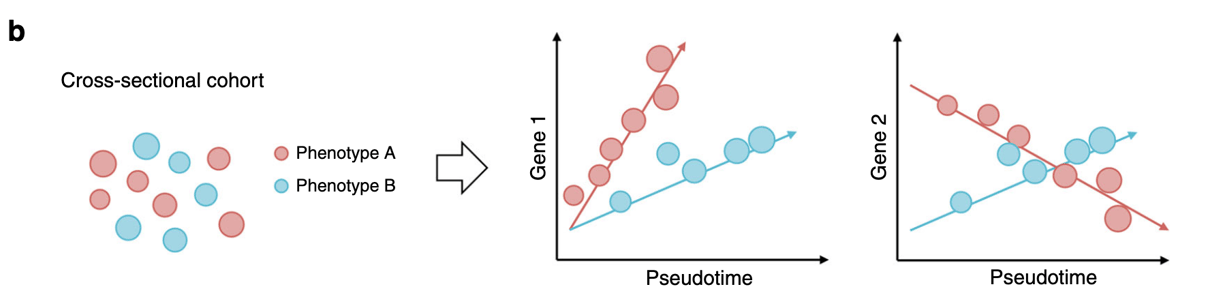
Cross-sectional (or static comparisons) are prevalent in molecular omics-based studies, but these studies provide little information on the effects of time. On the other hand, longitudinal studies can be difficult to perform as these require a lot of resources. This manuscript offers a possibility of converting a cross-sectional data into a series of values, termed as pseudotime. The concept is that every individual would behave asynchronously, which would thus represent a different stage of progression. The stages of pseudotime are then mapped to create a trajectory (See Figure a).
Besides implementing the single cell sequencing algorithms, they implemented a Bayesian statistical framework to include the ability to add factors of interest. This would then allow users to understand the covariates involved in the pseudotime progression between groups. The authors term their method as “PhenoPath.” See Figure b below.
The authors then went on to test datasets and show that the pseudotime analysis is similar to gene expression profiles when cells are collected over various timepoints. This could be an interesting method to look into temporal analysis from a static dataset.
New inspiration and motivation for us
The study provides new possibility of investigating time-series molecular events from a static dataset. However, this is only possible if the clinical parameters are also gathered during the clinical investigations. There is hence a critical need to collect clinical parameters at the time-points where omics data are acquired so that data scientists can delve into time-studies if need to. An integration of correlation methods such as WGCNA, Pearson/Spearman/Phik correlation with clinical parameters can also shed further insights into the key temporal events that are involved in disease progression in humans. Can this method eventually replace the time-series data collection in the future? Only time will reveal...
Article summary
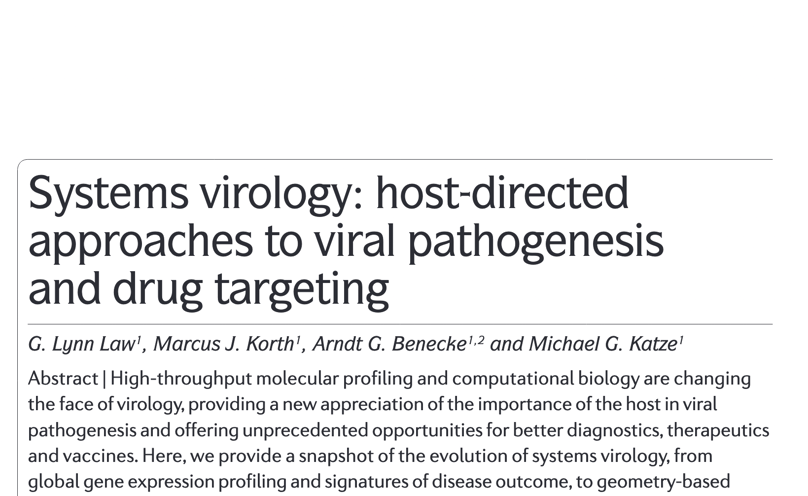
Systems virology can identify gene expression signatures that are predictive of viral pathogenesis and vaccine efficacy, insights into how viruses disrupt cellular metabolism, and the mapping of virus–host interactomes. In these recent years, the field has progressed from genomics-based approaches to measurements of proteins and metabolites, and has also embraced the analysis of host genetic variation as a means to better understand disease processes. The authors highlight some important considerations to harness important information from systems virology.
They highlight that the field must move beyond just the listing of molecules that are differentially expressed on viral infection. Instead, the relationships between key molecules will have to be better defined. Such relationships may be cause-and-effect relationships, the result of co-expression, or due to genetic or direct physical interactions. Network modelling and analysis can help explore the relationships among molecules and the structure and organization of these relationships to better predict the behaviour of the network or system.
Finally, it will also be necessary to consider nonlinear relationships such as how the network functions over time. This is particularly true in light of evidence that the magnitude and timing of the host response to respiratory viruses are crucial determinants of the eventual disease outcome.
New inspiration and motivation for us
Human variation can be frustrating to work with, but we believe that it can provide opportunities for us to understand disease processes better. Approaching the research question systematically with the right exploratory data analysis tools will be critical to identify outliers and confounding factors. In addition, we can supplement our findings with curated databases to investigate baseline individual omics signature profile that influence host responses to viruses.
To manage human variation, setting the appropriate thresholds will be important. In many cases, when the cutoffs are too stringent, a lot of information may be lost, creating voids in data analysis. Hence, besides using differentially expressed genes to characterise human responses, these analyses should be supplemented with GSEA pre-rank analysis to confirm that the assigned cutoffs are appropriate.
The ingenuity pathway analysis provides some insights into the relationship between genes, but their relationship with viruses can be difficult to ascertain as the information is not consolidated and accessible. We believe we can do more in this area.
Our experience with human responses to viruses also highlight the importance of magnitude and time in data analysis. To capture both linear and non-linear relationships across time, we believe that extraction and analysis of differential gene expression (EDGE) with self-organising maps (SOM) analysis will remain relevant to capture all these events. Readers can read our newly published article published in EBioMedicine to find out how we used EDGE and SOM to characterise the dynamic transcriptomic profile in severe COVID-19 patients.
My recommended books and articles
1 January 2022


I would like to recommend a book entitled "Practical Data Science with Python." The book covers from basic concepts of how you can use Python to analyse datasets to advanced concepts such as statistical comparisons, data distribution and machine learning. The book is easy to read and the codes provided are up-to-date, which will appeal to data scientists who are keen in learning Python. In addition, they provide the codes in Jupyter Notebooks so users can access the material and implement the codes directly. Finally, the ebook is available at just USD $5 (during Jan 2022), which is really cheap for the amount of content covered. So if Python is the programming language you want to master in 2022, please get one of these very helpful book. More details of the contents in the book are covered in my blog.
1 - 31 January 2022


Exploratory data analysis is critical in understanding the dataset, so that we are aware of the presence of null values, duplicate values, relationship between variables, distribution of data etc. In Python, these can be easily performed by using 3 lines of codes. To learn about the details, feel free to read my blog article here.


Correlation coefficients are informative in describing the strength of correlation between 2 different variables. The Pearson's coefficient, for instance, describes the strength of linear correlation between 2 variables. In cases where there are more outliers in the dataset and where data distribution is not following a Gaussian distribution, Spearman's correlation can be used. We are also excited about the new correlation, namely the Phik correlation, which can capture non-linear relationships. Since many of the biological trends do not conform to a linear distribution, we think that the Phik correlation can potentially address this gap, to help us better understand biological associations. For more details, please read my blog article here and here.